What Is a Tensile Testing Machine and How Does It Work?
A tensile testing machine is a controlled instrument used to measure how materials behave under pulling forces. It grips a specimen and separates the grips at a defined speed. Engineers use this process to identify tensile strength, yield strength, elongation, and fracture behavior. These values help manufacturers select materials for bridges, vehicle parts, packaging, and medical devices. The test looks straightforward. Its results are not always simple.
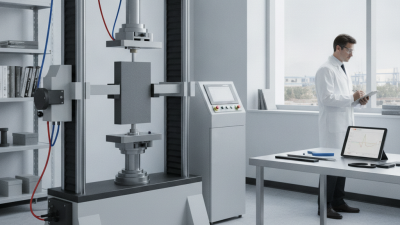
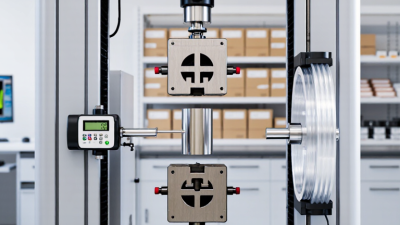
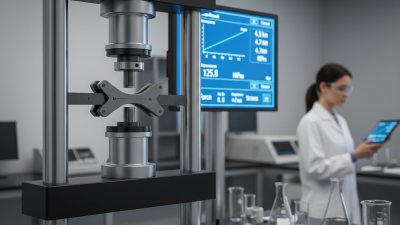
A typical system includes a rigid frame, powered crosshead, load cell, grips, and measurement software. The upper and lower grips hold the specimen securely. The load cell records force as the crosshead moves. An extensometer measures small changes in gauge length with greater accuracy. The setup matters. Misaligned grips can bend the specimen and distort the final data. Small errors matter. Experienced technicians check specimen dimensions, grip pressure, test speed, and machine calibration before testing.
Reliable testing depends on recognized procedures and careful documentation. Laboratories may follow standards such as ASTM E8 or ISO 6892-1, depending on the material and application. These standards define specimen shapes, loading conditions, and reporting methods. Operators should record material orientation, temperature, batch information, and any unusual failure pattern. No test is perfectly clean. Surface scratches, poor alignment, or early slipping can influence the result. A trustworthy report explains these limitations instead of hiding them. This article examines how a tensile testing machine works, what its measurements mean, and where practical judgment remains necessary.
Definition and Purpose of a Tensile Testing Machine
What Is a Tensile Testing Machine and How Does It Work?
Definition and Purpose of a Tensile Testing Machine
A tensile testing machine measures how a material responds when pulled apart. It applies a controlled force to a prepared specimen until the specimen stretches or breaks. Engineers use this process to evaluate strength, stiffness, ductility, and failure behavior.
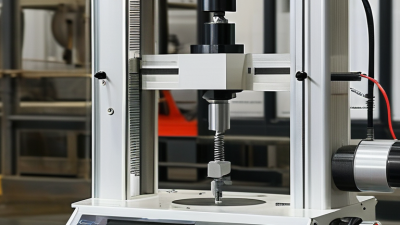
The machine holds the specimen between two aligned grips. A motor moves one grip at a controlled speed, while a load cell records the applied force. An extensometer may measure elongation directly from the specimen. The testing software then produces a stress-strain curve, showing important values such as tensile strength, yield strength, and percentage elongation.
The purpose is practical. Manufacturers can compare materials, verify production quality, and select suitable materials for products. A technician should check specimen dimensions, grip alignment, test speed, and sensor calibration before testing. Small errors can change the final result. That part is easy to underestimate.
In real laboratories, broken specimens often reveal more than a single strength value. A clean, centered fracture may suggest uniform loading. An angled break can indicate misalignment or an uneven sample. Results should be reviewed against accepted procedures, such as relevant ASTM or ISO methods. Still, no test is perfect. Material history, temperature, surface defects, and operator handling may influence the data. Careful records make the findings more reliable.
Main Components and Their Functions
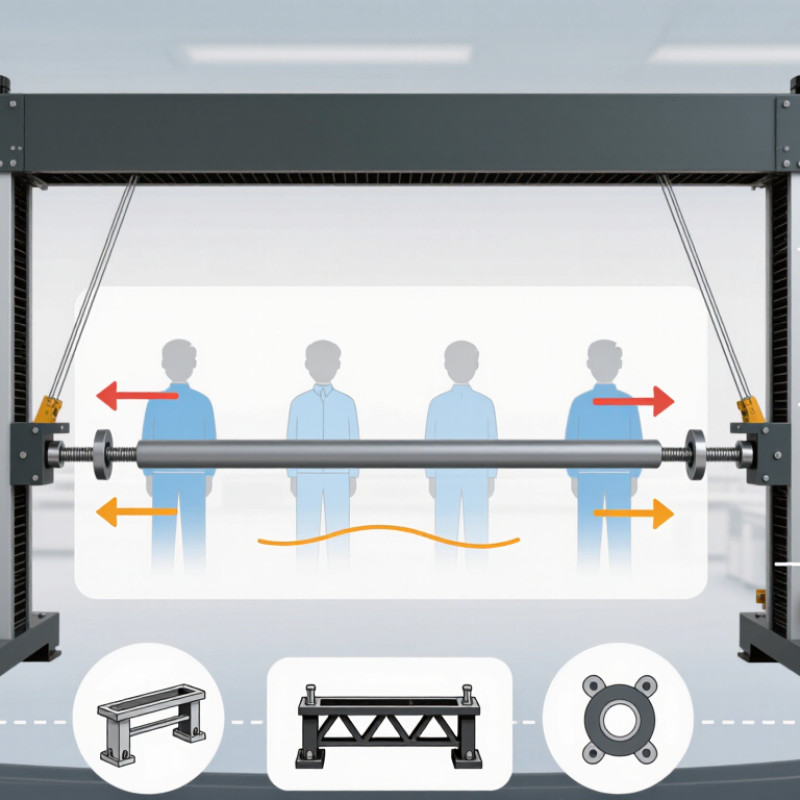
A tensile testing machine measures how a material responds to controlled pulling. Its load frame provides the rigid structure. Two opposing crossheads move apart at a defined speed. ASTM E8/E8M-24 commonly uses a four-times-diameter gauge length for round specimens, making geometry essential for reliable elongation data. A small alignment error can bend the sample and distort the result.
The grips hold the specimen firmly without crushing its edges. Wedge grips suit metals, while pneumatic grips can reduce slipping in thinner materials. A calibrated load cell converts force into electrical data. An extensometer measures gauge-length extension more accurately than crosshead movement. ISO 6892-1:2019 requires controlled strain-rate methods for metallic materials, because speed can change yield and tensile-strength values. The drive system controls motion, and the software records force, displacement, stress, strain, and failure point.
Calibration is not decoration. It supports traceability and measurement confidence, as emphasized by NIST Technical Note 1297. Operators should inspect grip faces, verify zero readings, and check specimen dimensions before testing. Real laboratories still encounter imperfect fractures, uneven clamping, and noisy signals. These problems deserve investigation, not silent deletion. A useful report should identify the load-cell capacity, extensometer gauge length, test speed, specimen standard, and uncertainty. The machine supplies numbers; disciplined setup gives them meaning.
What Is a Tensile Testing Machine and How Does It Work?
A tensile testing machine applies a controlled pulling force to a specimen while measuring force and elongation. This representative engineering stress-strain curve uses typical values for low-carbon steel: the load cell measures force, the grips transfer force, the crosshead creates movement, and the extensometer measures specimen elongation. The curve shows elastic behavior, yielding, strain hardening, and necking before fracture.
Measurements and Properties Obtained from the Test
A tensile testing machine pulls a prepared specimen until it stretches and breaks. Its grips hold the material firmly while a controlled crosshead applies force. Load cells measure the pulling force continuously. An extensometer or displacement sensor records changes in gauge length. The system then creates a stress–strain curve from these measurements. Alignment matters greatly.
Engineers calculate engineering stress by dividing force by the specimen’s original cross-sectional area. Engineering strain equals extension divided by the original gauge length. The initial straight section helps determine Young’s modulus, which describes elastic stiffness. Yield strength shows when permanent deformation begins. Ultimate tensile strength identifies the highest engineering stress reached during loading. Elongation at break measures how much the specimen stretched before fracture. Reduction of area describes local thinning near the break.
These values reveal different material behaviors. A high modulus suggests limited elastic deformation under load. High elongation often indicates strong ductility. Fracture appearance can also provide useful evidence. A narrow, angled break may suggest ductile failure, while a flatter break may require closer investigation. Test speed, temperature, specimen shape, and surface condition can change the results. Real tests are rarely perfect. A slightly loose grip can produce misleading extension data. Even careful laboratories should inspect the curve for sudden slips or irregular noise. Repeat tests improve confidence, but they do not remove every source of uncertainty.
What Is a Tensile Testing Machine and How Does It Work? - Measurements and Properties Obtained from the Test
| Measurement or Property |
Symbol |
Unit |
Illustrative Value |
What the Machine Measures or Calculates |
| Test Setup and Direct Measurements |
| Initial Gauge Length |
L0 |
mm |
50.00 |
The marked length of the specimen before loading. It is used to calculate engineering strain and percentage elongation. |
| Initial Cross-Sectional Area |
A0 |
mm² |
37.50 |
The original area perpendicular to the loading direction. For a rectangular specimen, it is calculated from initial width and thickness. |
| Test Speed |
v |
mm/min |
5.0 |
The controlled crosshead speed. The selected speed depends on the material and the applicable testing procedure. |
| Applied Force |
F |
kN |
0–15.75 |
The axial tensile load recorded by the machine load cell throughout the test. |
| Elongation |
ΔL |
mm |
0–14.00 |
The change in gauge length measured by an extensometer or calculated from crosshead displacement when permitted by the test method. |
| Stress–Strain Results |
| Engineering Stress |
σ |
MPa |
0–420 |
Calculated by dividing the instantaneous force by the original cross-sectional area: σ = F / A0. |
| Engineering Strain |
ε |
% |
0–28.0 |
Calculated from the change in gauge length relative to the original gauge length: ε = (ΔL / L0) × 100. |
| Elastic Modulus |
E |
GPa |
200 |
The slope of the initial linear portion of the stress–strain curve. It describes elastic stiffness and is recoverable after unloading within the elastic range. |
| Yield Strength |
Rp0.2 |
MPa |
275 |
The stress associated with the beginning of significant permanent deformation. A 0.2% offset method is commonly used when a distinct yield point is not visible. |
| Ultimate Tensile Strength |
Rm |
MPa |
420 |
The maximum engineering stress reached during the test. It is calculated from the maximum recorded force divided by the original area. |
| Maximum Tensile Force |
Fmax |
kN |
15.75 |
The highest load recorded before the specimen begins to neck or otherwise lose load-carrying capacity. |
| Ductility and Fracture Properties |
| Percentage Elongation After Fracture |
A |
% |
28.0 |
The permanent increase in the original gauge length after the broken pieces are carefully fitted together. |
| Final Gauge Length |
Lu |
mm |
64.00 |
The gauge length measured after fracture. Percentage elongation is calculated as ((Lu − L0) / L0) × 100. |
| Reduction of Area |
Z |
% |
45.0 |
The decrease in cross-sectional area at the fracture location, calculated from the original and minimum final areas. |
| Minimum Fracture Area |
Au |
mm² |
20.63 |
The smallest cross-sectional area measured at the necked region after fracture. |
| Fracture Load |
Ff |
kN |
8.90 |
The force carried by the specimen immediately before complete separation. |
| How the Tensile Testing Machine Works |
| Specimen Gripping |
— |
— |
Fixed alignment |
Wedges or mechanical grips hold the specimen along its axis so that the applied force is transferred uniformly and bending is minimized. |
| Crosshead Movement |
— |
mm/min |
Controlled |
A motor-driven crosshead moves at a specified rate, producing tensile deformation until the specimen yields and fractures. |
| Force Measurement |
— |
kN |
Continuous |
A calibrated load cell converts the applied force into an electrical signal that is recorded against time or displacement. |
| Strain Measurement |
— |
mm or % |
Continuous |
An extensometer or displacement sensor records specimen extension, allowing the software to generate a stress–strain curve. |
| Test Output |
— |
— |
Curve and report |
The system displays the force–extension and stress–strain curves and calculates strength, stiffness, ductility, and fracture-related properties. |
Data note: The numerical values are illustrative results for a generic metallic tensile specimen with an original gauge length of 50 mm and an original cross-sectional area of 37.50 mm². Actual results vary with material composition, specimen geometry, surface condition, temperature, test speed, and the applicable testing procedure.
Applications and Factors Affecting Test Accuracy
What Is a Tensile Testing Machine and How Does It Work?
A tensile testing machine measures how a material responds to controlled pulling. It holds a specimen between two grips and applies force at a selected speed. A load cell records force, while an extensometer or displacement sensor records elongation. The resulting curve reveals tensile strength, yield behavior, stiffness, and failure strain.
These measurements support quality control and research in metals, plastics, rubber, textiles, wires, and construction materials. Engineers may compare batches, check production consistency, or study how heat and moisture affect performance. Test accuracy depends on more than the machine itself. Correct specimen dimensions matter. Smooth edges reduce unexpected cracks. Grips must align with the loading axis. Even a small offset can create bending and distort the result. Calibration should be verified regularly, not assumed. Temperature, humidity, loading speed, and sensor resolution also influence the data. No test is perfect.
Tips:
Use specimens from representative locations and record their history. Check grip pressure before testing; excessive pressure can damage soft materials. Keep the testing area stable and inspect the force curve for unusual noise. Repeat tests with enough samples to identify variation. If results look surprisingly high, investigate the setup before celebrating. That reflection often prevents a costly decision.