


Material Testing Blog

HomeMaterial Testing Blog

How to Choose Water Treatment Equipment in 2026?

Choosing Water Treatment Equipment in 2026 requires more than comparing prices and product photographs. Water sources are changing, energy costs remain uncertain, and treatment standards continue to develop. A reliable decision begins with evidence from the actual site, not a sales brochure.

Test the incoming water. Measure turbidity, hardness, pH, iron, microbial risks, and seasonal variation. A clear sample can still hide serious contamination. Record daily flow, peak demand, pressure, temperature, and available installation space. These details determine whether filtration, ultrafiltration, reverse osmosis, ultraviolet treatment, or combined systems are appropriate.

Small details matter.

In practical projects, clogged prefilters, noisy pumps, and poorly placed drains often create larger problems than expected. Equipment should be evaluated through verified performance data, maintenance access, replacement-part availability, and total operating cost. Ask suppliers for test results, warranty terms, certifications, and references from similar applications. Independent laboratory analysis can challenge optimistic claims.

No system fits every facility.

This guide examines how to match treatment technology with water quality, production needs, budget, and long-term reliability. It also considers energy consumption, chemical use, monitoring instruments, automation, and safe operator access. Some assumptions may prove wrong after installation, especially when water chemistry changes throughout the year. That is why pilot testing and scheduled reviews remain valuable. Expert advice helps, but transparent evidence matters more. The strongest choice is not always the most advanced system. It is the system that performs consistently, can be maintained responsibly, and protects users without creating avoidable environmental burdens.
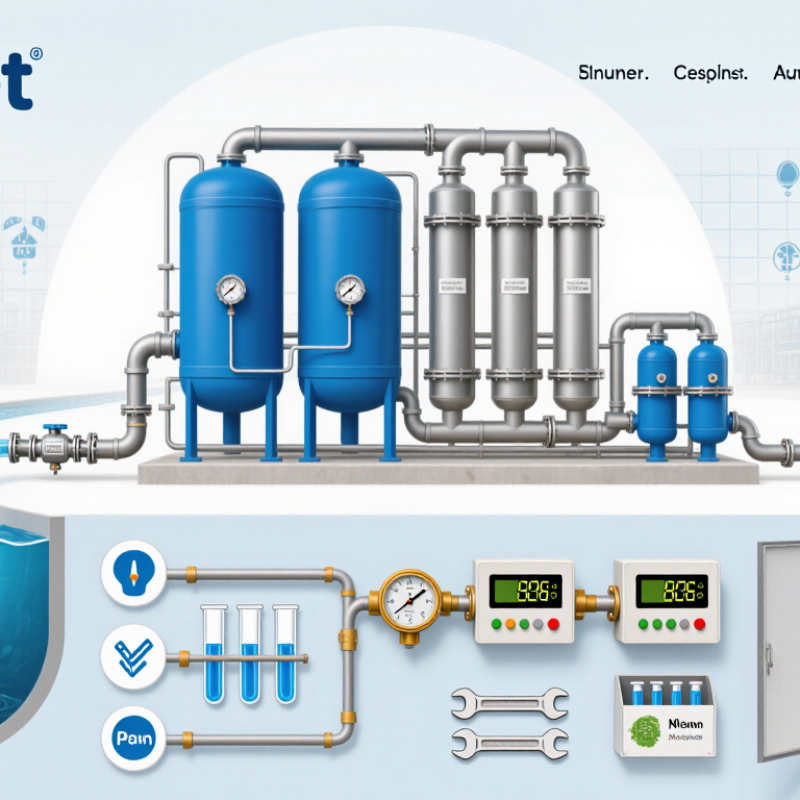
How to Choose Water Treatment Equipment in 2026?

Set Water Targets: WHO Reports 2.2 Billion Lack Safely Managed Drinking Water

WHO reports that 2.2 billion people lack safely managed drinking water. That figure makes equipment selection a public health decision, not merely a technical purchase.

Start by setting measurable water targets. Test source water for bacteria, turbidity, iron, hardness, salinity, and chemical pollutants. Record seasonal changes too. A clear sample can still contain invisible hazards. Define acceptable limits, daily demand, pressure, maintenance capacity, and operator skills before choosing equipment.

Match treatment stages to the evidence. Sediment filters can reduce visible particles. Disinfection can control microorganisms. Membranes may address dissolved salts, but they create concentrated wastewater. That detail is often overlooked. In a rural facility, simple systems may perform better than complex units without spare parts or trained operators. In a busy building, automatic monitoring may justify higher costs. I would not trust a supplier’s test alone. Ask for independent laboratory results, operating data, cleaning requirements, and realistic replacement schedules. Targets may need revision after field testing. That is not failure; it is responsible design.

Map Contaminants to Technology: EPA Regulates 90 Drinking-Water Pollutants

How to Choose Water Treatment Equipment in 2026?

EPA regulates 90 drinking-water contaminants under its National Primary Drinking Water Regulations. That number should shape equipment selection, not just a product catalog. Start with a current laboratory analysis of raw and treated water. Test metals, microbes, nitrate, disinfection by-products, and emerging contaminants such as PFAS. Different pollutants need different barriers. Activated carbon can reduce many organic chemicals, while ion exchange targets selected ions. Reverse osmosis can remove dissolved salts, but it creates a concentrate stream that requires careful management.

EPA’s 2023 Drinking Water Infrastructure Needs Survey estimates that the United States needs about 625 billion dollars in drinking-water investment from 2023 to 2043. This signals a practical concern: equipment must perform reliably, not merely meet a brochure claim. EPA’s 2024 PFAS rule sets limits of 4.0 nanograms per liter for PFOA and PFOS. At that level, sampling quality and maintenance become critical. A small error matters.

Tips: Map each detected contaminant to a verified treatment mechanism. Check flow rate, pressure, temperature, and peak demand before sizing equipment. Request independent performance data, not vague removal percentages. Review media replacement, membrane cleaning, waste handling, and operator training. Some systems look efficient on paper. Field conditions can disagree. Re-test after installation, because source-water chemistry changes seasonally and treatment assumptions may age badly.

Size for Peak Flow: Use Demand, Pressure, Recovery, and a 15% Reserve

In 2026, size water treatment equipment for peak flow, not average daily use. The Water Research Foundation’s Residential End Uses of Water, Version 2 reports about 58.6 gallons per person daily indoors. That figure hides short, demanding events. A shower, toilet refill, and washing machine may operate together.

I start with fixture demand and measure the busiest ten-minute period. If peak demand reaches 12 gallons per minute, a 15% reserve raises the design target to 13.8 gallons per minute. Keep the calculation visible. A neat spreadsheet can still mislead. The U.S. EPA WaterSense program reports that household leaks waste more than 9,400 gallons annually, so uncontrolled losses can distort demand readings.

Pressure must be checked dynamically at the most distant outlet. Static pressure looks impressive. It is not enough. Include pipe friction, filter loading, elevation, and the equipment’s minimum operating pressure. For membrane systems, recovery changes the calculation: at 75% recovery, producing 7.5 gallons per minute requires 10 gallons per minute of feedwater. A 15% reserve should cover realistic fouling and demand variation, not compensate for poor maintenance. Oversizing also deserves caution. It can reduce contact time, increase cycling, and create unnecessary capital cost. Professional guidance from AWWA manuals and manufacturer-independent hydraulic practice supports verifying flow, pressure, and recovery under actual site conditions.

Compare RO, UF, UV, and GAC by Removal, Energy, and 50–85% RO Recovery

Choosing water treatment equipment in 2026 should begin with a water analysis, not a catalog. Feed-water quality can change the decision quickly. In field assessments, RO removes dissolved salts, many metals, and numerous contaminants. It needs pressure and effective pretreatment. RO recovery commonly ranges from 50% to 85%; the remaining flow becomes concentrate. Higher recovery saves water, yet scaling risk increases when controls are weak. That trade-off deserves attention.

UF usually consumes less energy than RO because it operates at lower pressure. However, it does not reliably remove dissolved minerals or all small molecules. UV provides microbial inactivation without removing salts, particles, or chemicals. It also needs a clean lamp sleeve and suitable water clarity. GAC can reduce chlorine, odor, taste, and selected organic compounds. Adsorption is finite. Performance may decline before the water looks different.

Compare contaminant targets, flow rate, maintenance, power use, and concentrate handling. Do not choose RO only because its removal table looks impressive. Measure conductivity before and after treatment, and test for the actual contaminant. An 80% recovery setting may appear efficient, but unstable feed water can increase cleaning frequency. An experienced operator may select 65% recovery for steadier output. That is not failure; it is a design compromise. Independent laboratory testing and scheduled verification support more reliable decisions.

How to Choose Water Treatment Equipment in 2026? - Compare RO, UF, UV, and GAC by Removal, Energy, and 50–85% RO Recovery
Technology Primary Treatment Function Typical Removal or Inactivation Typical Energy Demand Typical Water Recovery Main Advantages Main Limitations
Reverse Osmosis (RO) Pressure-driven membrane separation for dissolved salts, ions, many metals, nitrate, fluoride, and numerous dissolved contaminants. Typically removes about 95–99% of total dissolved solids and many dissolved ionic contaminants when correctly designed and operated. Removal varies by contaminant, membrane, pH, temperature, and feedwater quality. Approximately 0.3–1.5 kWh/m³ for many brackish-water systems; seawater systems commonly require about 3–6 kWh/m³ because of higher operating pressure. 50–85% for many brackish-water and municipal designs. Seawater systems often operate at lower recovery, commonly around 35–50%. Best option when low salinity, low conductivity, or broad dissolved-contaminant reduction is required. Produces a concentrate stream, requires pretreatment, operates under pressure, and may be affected by scaling, fouling, and membrane degradation.
Ultrafiltration (UF) Low-pressure membrane filtration for suspended solids, colloids, turbidity, bacteria, and protozoan cysts. Can provide approximately 4–6 log removal of bacteria and protozoa with an intact, properly operated membrane. It generally provides limited and unreliable removal of dissolved salts and many small viruses. Approximately 0.05–0.30 kWh/m³, depending on flux, transmembrane pressure, backwashing, feedwater quality, and system scale. Often about 90–99%; lower values may occur when frequent backwashing or chemically enhanced cleaning is required. Excellent turbidity and particulate control with lower pressure and energy requirements than RO. Does not significantly reduce salinity, conductivity, hardness, or most dissolved chemicals; membrane integrity must be monitored.
Ultraviolet (UV) Physical disinfection using ultraviolet light to damage the DNA or RNA of microorganisms. Validated systems can achieve approximately 3–6 log inactivation of many bacteria, viruses, and protozoa at the specified UV dose. It does not remove dissolved chemicals, salts, turbidity, or particles. Approximately 0.01–0.10 kWh/m³ for many drinking-water and process-water systems; power depends strongly on UV dose, flow, lamp efficiency, and water clarity. Approximately 99–100% hydraulic recovery because there is normally no reject stream. Rapid, chemical-free microbial control with no change to taste, salinity, or mineral content. Requires low turbidity and good UV transmittance; provides no residual protection after treatment and requires lamp, sensor, and sleeve maintenance.
Granular Activated Carbon (GAC) Adsorption of chlorine, taste and odor compounds, and selected organic contaminants. Can remove more than 90% of free chlorine under suitable contact conditions. Organic-contaminant removal is highly variable and depends on carbon type, empty-bed contact time, concentration, temperature, and competing compounds. No significant reaction energy; pumping commonly adds approximately 0.01–0.05 kWh/m³, excluding backwash and regeneration requirements. Typically about 98–100% during normal flow; backwashing or carbon replacement creates a separate wastewater or solid-waste stream. Effective pretreatment for chlorine and many taste-and-odor problems; can protect downstream membranes from oxidants. Does not remove salts and is not a reliable stand-alone disinfection barrier. Exhausted carbon can release previously adsorbed contaminants if not replaced or regenerated on schedule.
Planning note: Values are typical engineering ranges, not guaranteed performance specifications. Actual results depend on feedwater analysis, temperature, pressure, membrane or media condition, contact time, pretreatment, operating controls, and the target water-quality standard. RO recovery should be selected only after evaluating scaling potential, concentrate disposal, and pretreatment requirements.

Check 2026 Compliance: Validate NSF/ANSI 42, 53, 55, and 58 Standards

How to Choose Water Treatment Equipment in 2026?

In 2026, water treatment selection should begin with verified compliance, not attractive performance claims. NSF/ANSI 42 covers aesthetic concerns, such as chlorine taste, odor, and visible particles. NSF/ANSI 53 addresses specific health-related contaminants, including lead, cysts, and some chemicals. The exact reduction claim matters. A filter certified for one contaminant may not reduce another.

For ultraviolet equipment, NSF/ANSI 55 applies to microbiological treatment systems. Class A systems provide a higher level of disinfection than Class B systems. Check the tested flow rate, lamp monitoring, and installation conditions.

Reverse osmosis equipment falls under NSF/ANSI 58, which can cover contaminant reduction, recovery, pressure, and material safety. These details affect real household performance.

Water changes. Test it first.

Ask for the current certification record, not only a printed logo. Confirm the exact model, configuration, replacement cartridge, and certified claims. Certification may apply to one version while a similar version remains untested.

Check whether the equipment requires prefiltration, drainage, electricity, or scheduled sanitation. A technically compliant system can still perform poorly when neglected.

I have seen buyers focus on laboratory ratings and overlook low water pressure, exhausted cartridges, or incorrect sizing. That mistake is easy to repeat. Review local water reports, independent test results, and professional installation guidance before purchasing.

Go to Top